2021-22 Macroinvertebrate Data
| macro_20210930073740.pdf |
Using Excel to Graph Macroinvertebrate Data
| macro_20201008075321.pdf |
Watershed Assignment Links
http://water.usgs.gov/edu/watershed.html
http://water.usgs.gov/edu/watercycleevaporation.html
http://water.usgs.gov/edu/watercycletranspiration.html
http://water.usgs.gov/edu/watercyclefreshstorage.html
“What is a Watershed?
http://techalive.mtu.edu/meec/module01/whatiswatershed.htm
http://techalive.mtu.edu/meec/module01/Infiltration.htm
“Land Use and the Hydrograph”
http://techalive.mtu.edu/meec/module01/Landuseimpacts.htm
http://water.usgs.gov/edu/watercycleevaporation.html
http://water.usgs.gov/edu/watercycletranspiration.html
http://water.usgs.gov/edu/watercyclefreshstorage.html
“What is a Watershed?
http://techalive.mtu.edu/meec/module01/whatiswatershed.htm
- Play the animation on the “What is a Watershed?” page. Describe what you are seeing in this animation.
http://techalive.mtu.edu/meec/module01/Infiltration.htm
“Land Use and the Hydrograph”
http://techalive.mtu.edu/meec/module01/Landuseimpacts.htm
Macroinvertebrate Identification
Use this activity to be able to:
-Discuss characteristics used to identify macroinvertebrates
-Use a key to identify macroinvertebrates.
Go the following website
Macroinvertebrate Identification Activity
-Discuss characteristics used to identify macroinvertebrates
-Use a key to identify macroinvertebrates.
Go the following website
Macroinvertebrate Identification Activity
River Habitat Paper
Maximum Total Points for the CQHEI is 114 If the score is over 100, consider it “extra credit.” You have an exceptional high-quality stream. A set of ranges for Excellent, Medium, Poor, Very Poor has not yet been developed for this index - but, QHEI scores > 60 have been found to be “generally conducive to the existence of warmwater fauna.”
Chemical Testing Instructions - http://www.orsanco.org/education/riverwatchers/chemical-testing-instructions/
Macroinvertebrate Graph Pt. 2
Open the spreadsheet and the data file. Enter the data for each group.
Use Excel to add up the totals Put all species of mayfly into the mayfly category. Do not add new categories.
As you are putting data in, don't do this by hand. I want you to use the excel functions.
Create a graph or a few graphs that would be a valuable tool to show the data from the macroinvertebrates. You will be using these graphs to analyze the data.
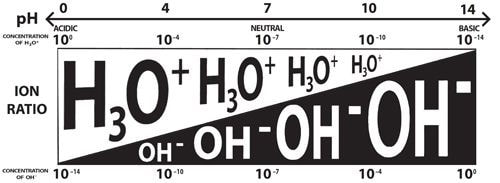
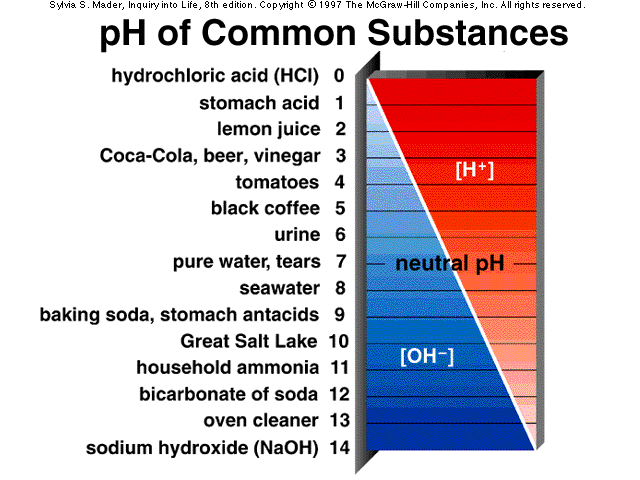
pH Assignment
On a piece of computer paper or in your composition book, draw the pH scale. Use color and show all numbers 0-14. Include 7 visual examples of acids, 7 visual examples of bases and 3 neutral substances. Place them where they belong on the scale.Also, define and use the following vocabulary:
- base/basic/alkaline/alkalinity
- acid/acidity
- hydronium
- hydroxide
- neutral
- neutralization
- hydrogen ions

|

|
|
|
|
| macroinvert data sept 2015 |
| 2019_s1_river_data_macroinvert.pdf |
| macroinvertebrate_spreadsheet.xlsx |
